TURNING BOOKS INTO VISUAL ART
At @dataandbooks , I combine my love for literature with technical expertise in NLP to create data visualizations that transform stories into visual art. These unique insights into beloved books have caught the attention of bestselling authors such as Nalini Singh, Raven Kennedy, and Christopher Paolini.
A little Bit About My Process
I’ve always been a passionate reader, particularly drawn to fantasy and romance. While reading, I often spot patterns that inspire me to create visual representations. This is how @dataandbooks came to life.
Every project begins with data. Depending on the book or series, this might involve:
- Analyzing text using NLP techniques.
- Scraping Goodreads reviews.
- Gathering information from wiki fan pages.
Once the data is ready, I sketch concepts to find the best way to bring the story to life visually. The complexity of the visualization dictates the tools I use:
- Simpler Visualizations: Flourish + Canva
- Complex Visualizations: D3.js + Affinity Designer
- Abstract Visualizations: Illustrator or Affinity for manual design
I write more about how I made some of my work in my Behance portfolio
Portfolio
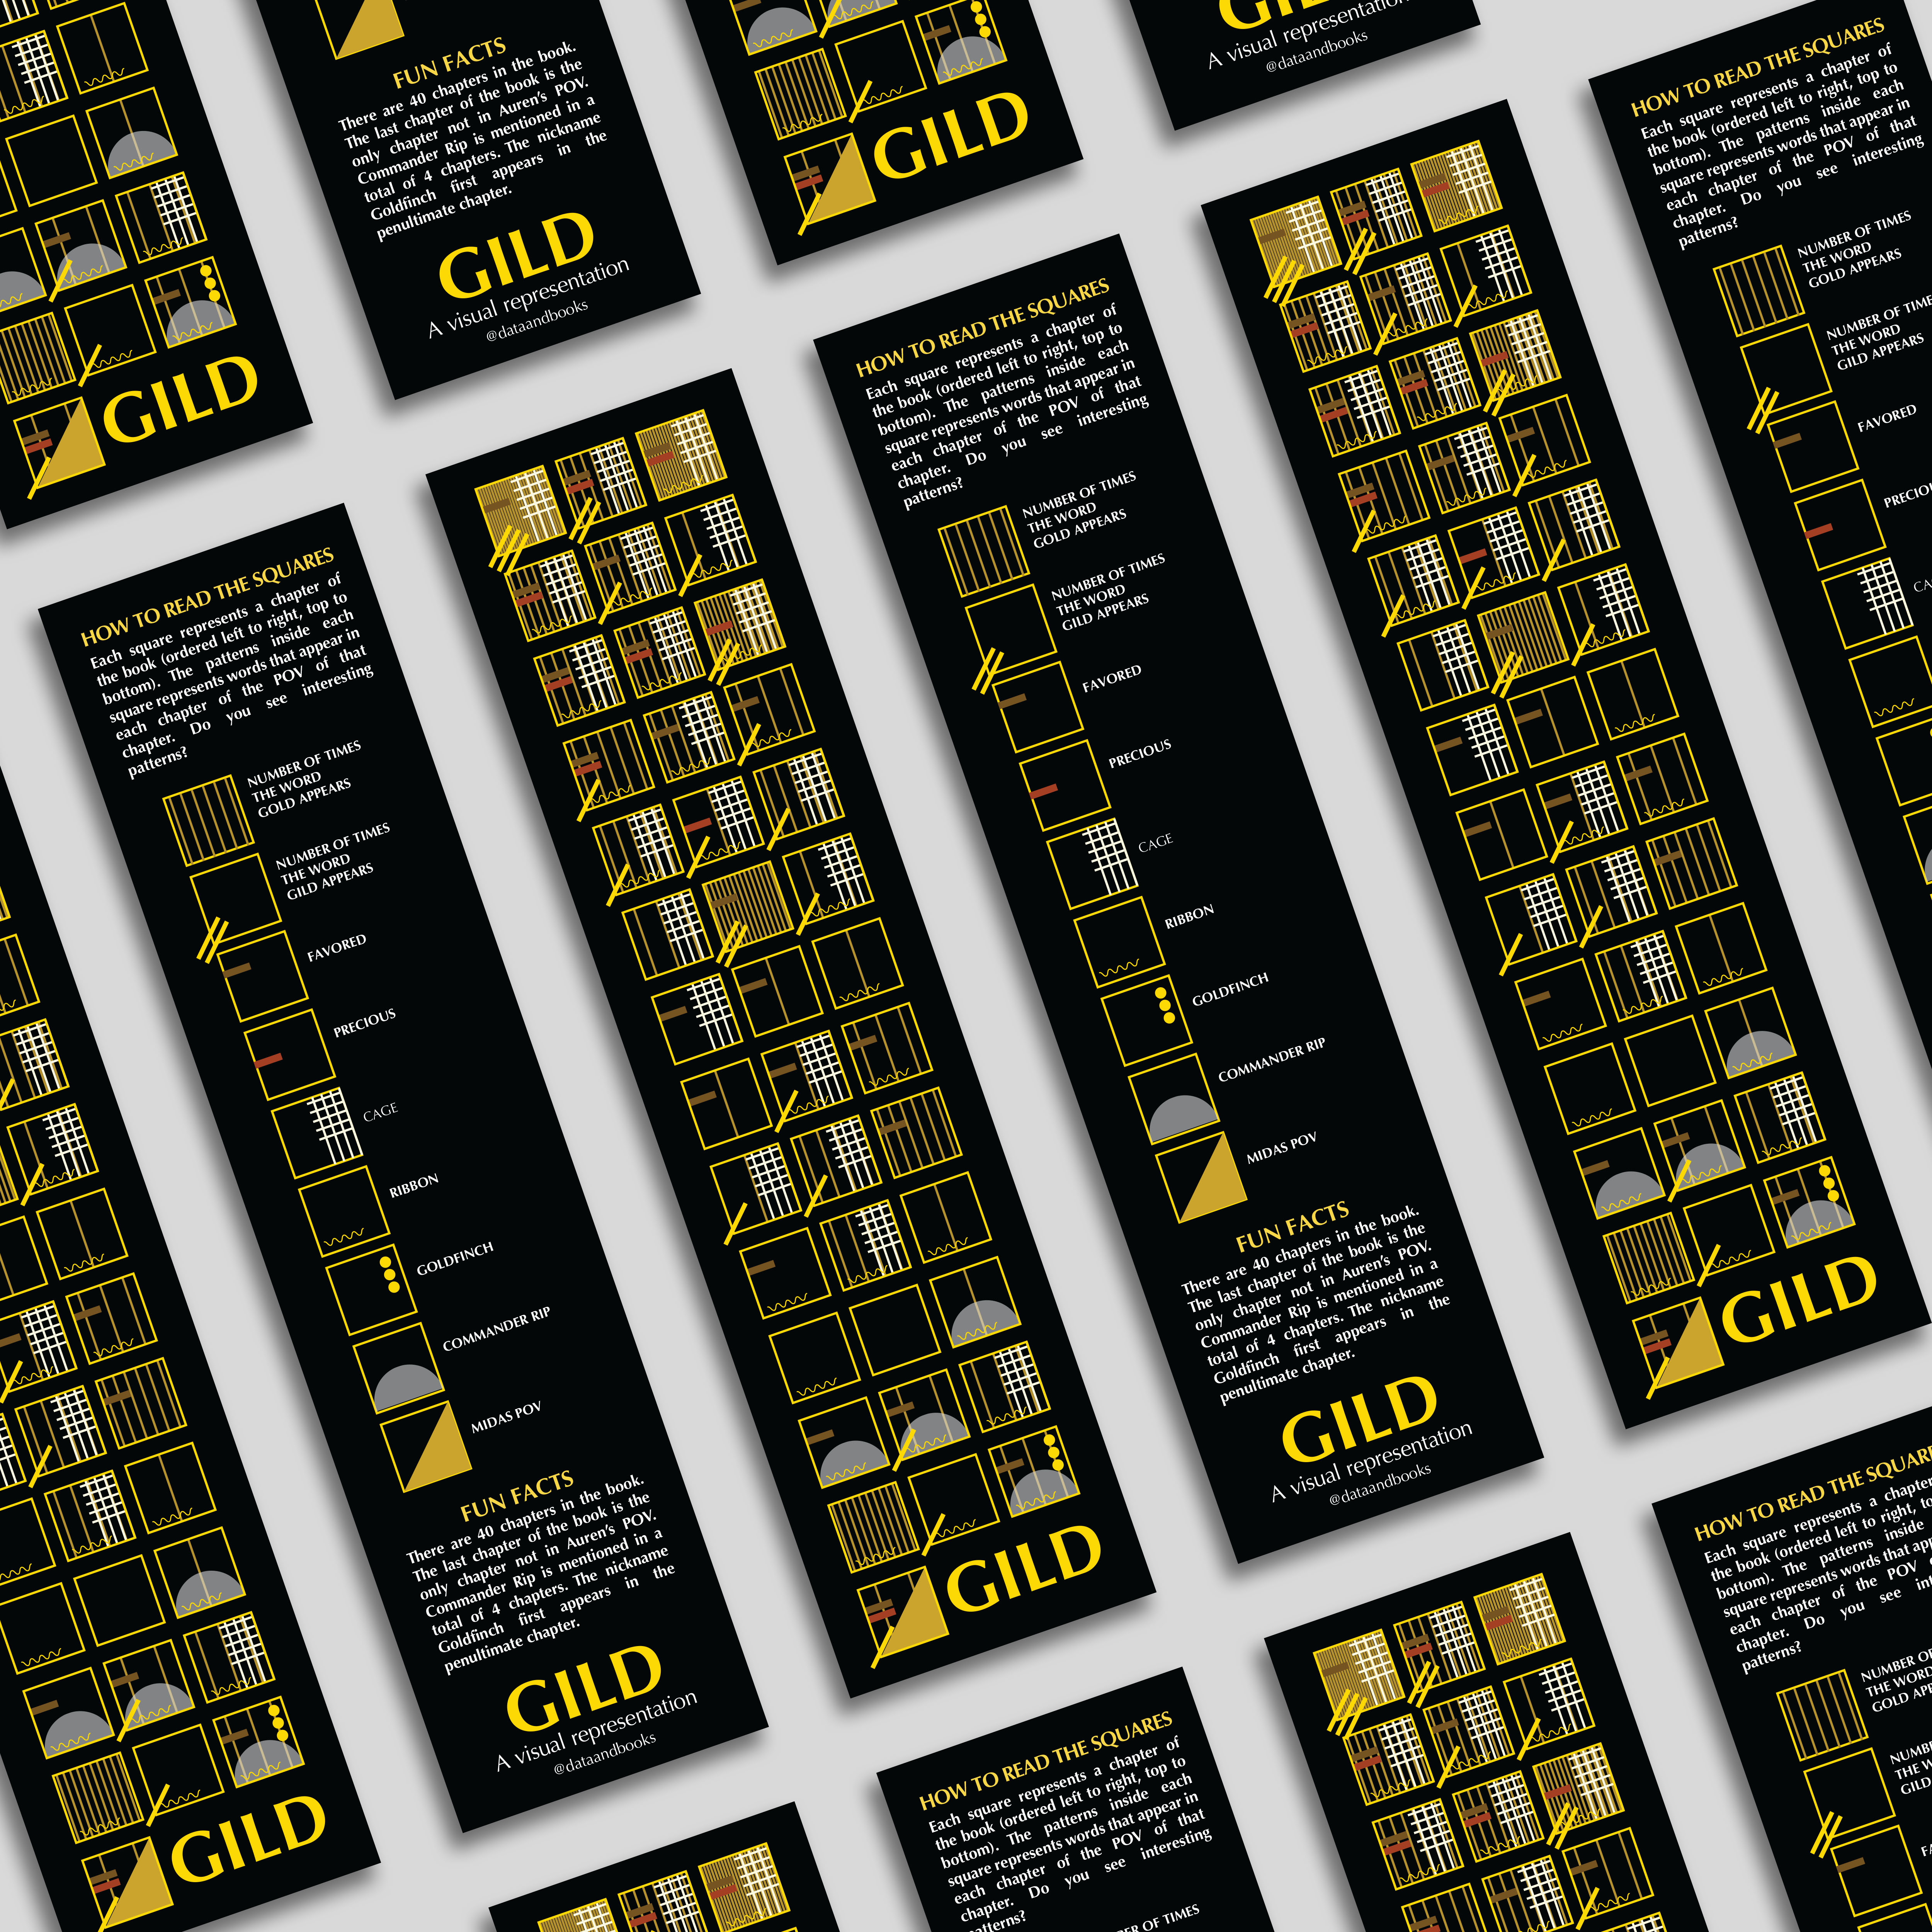
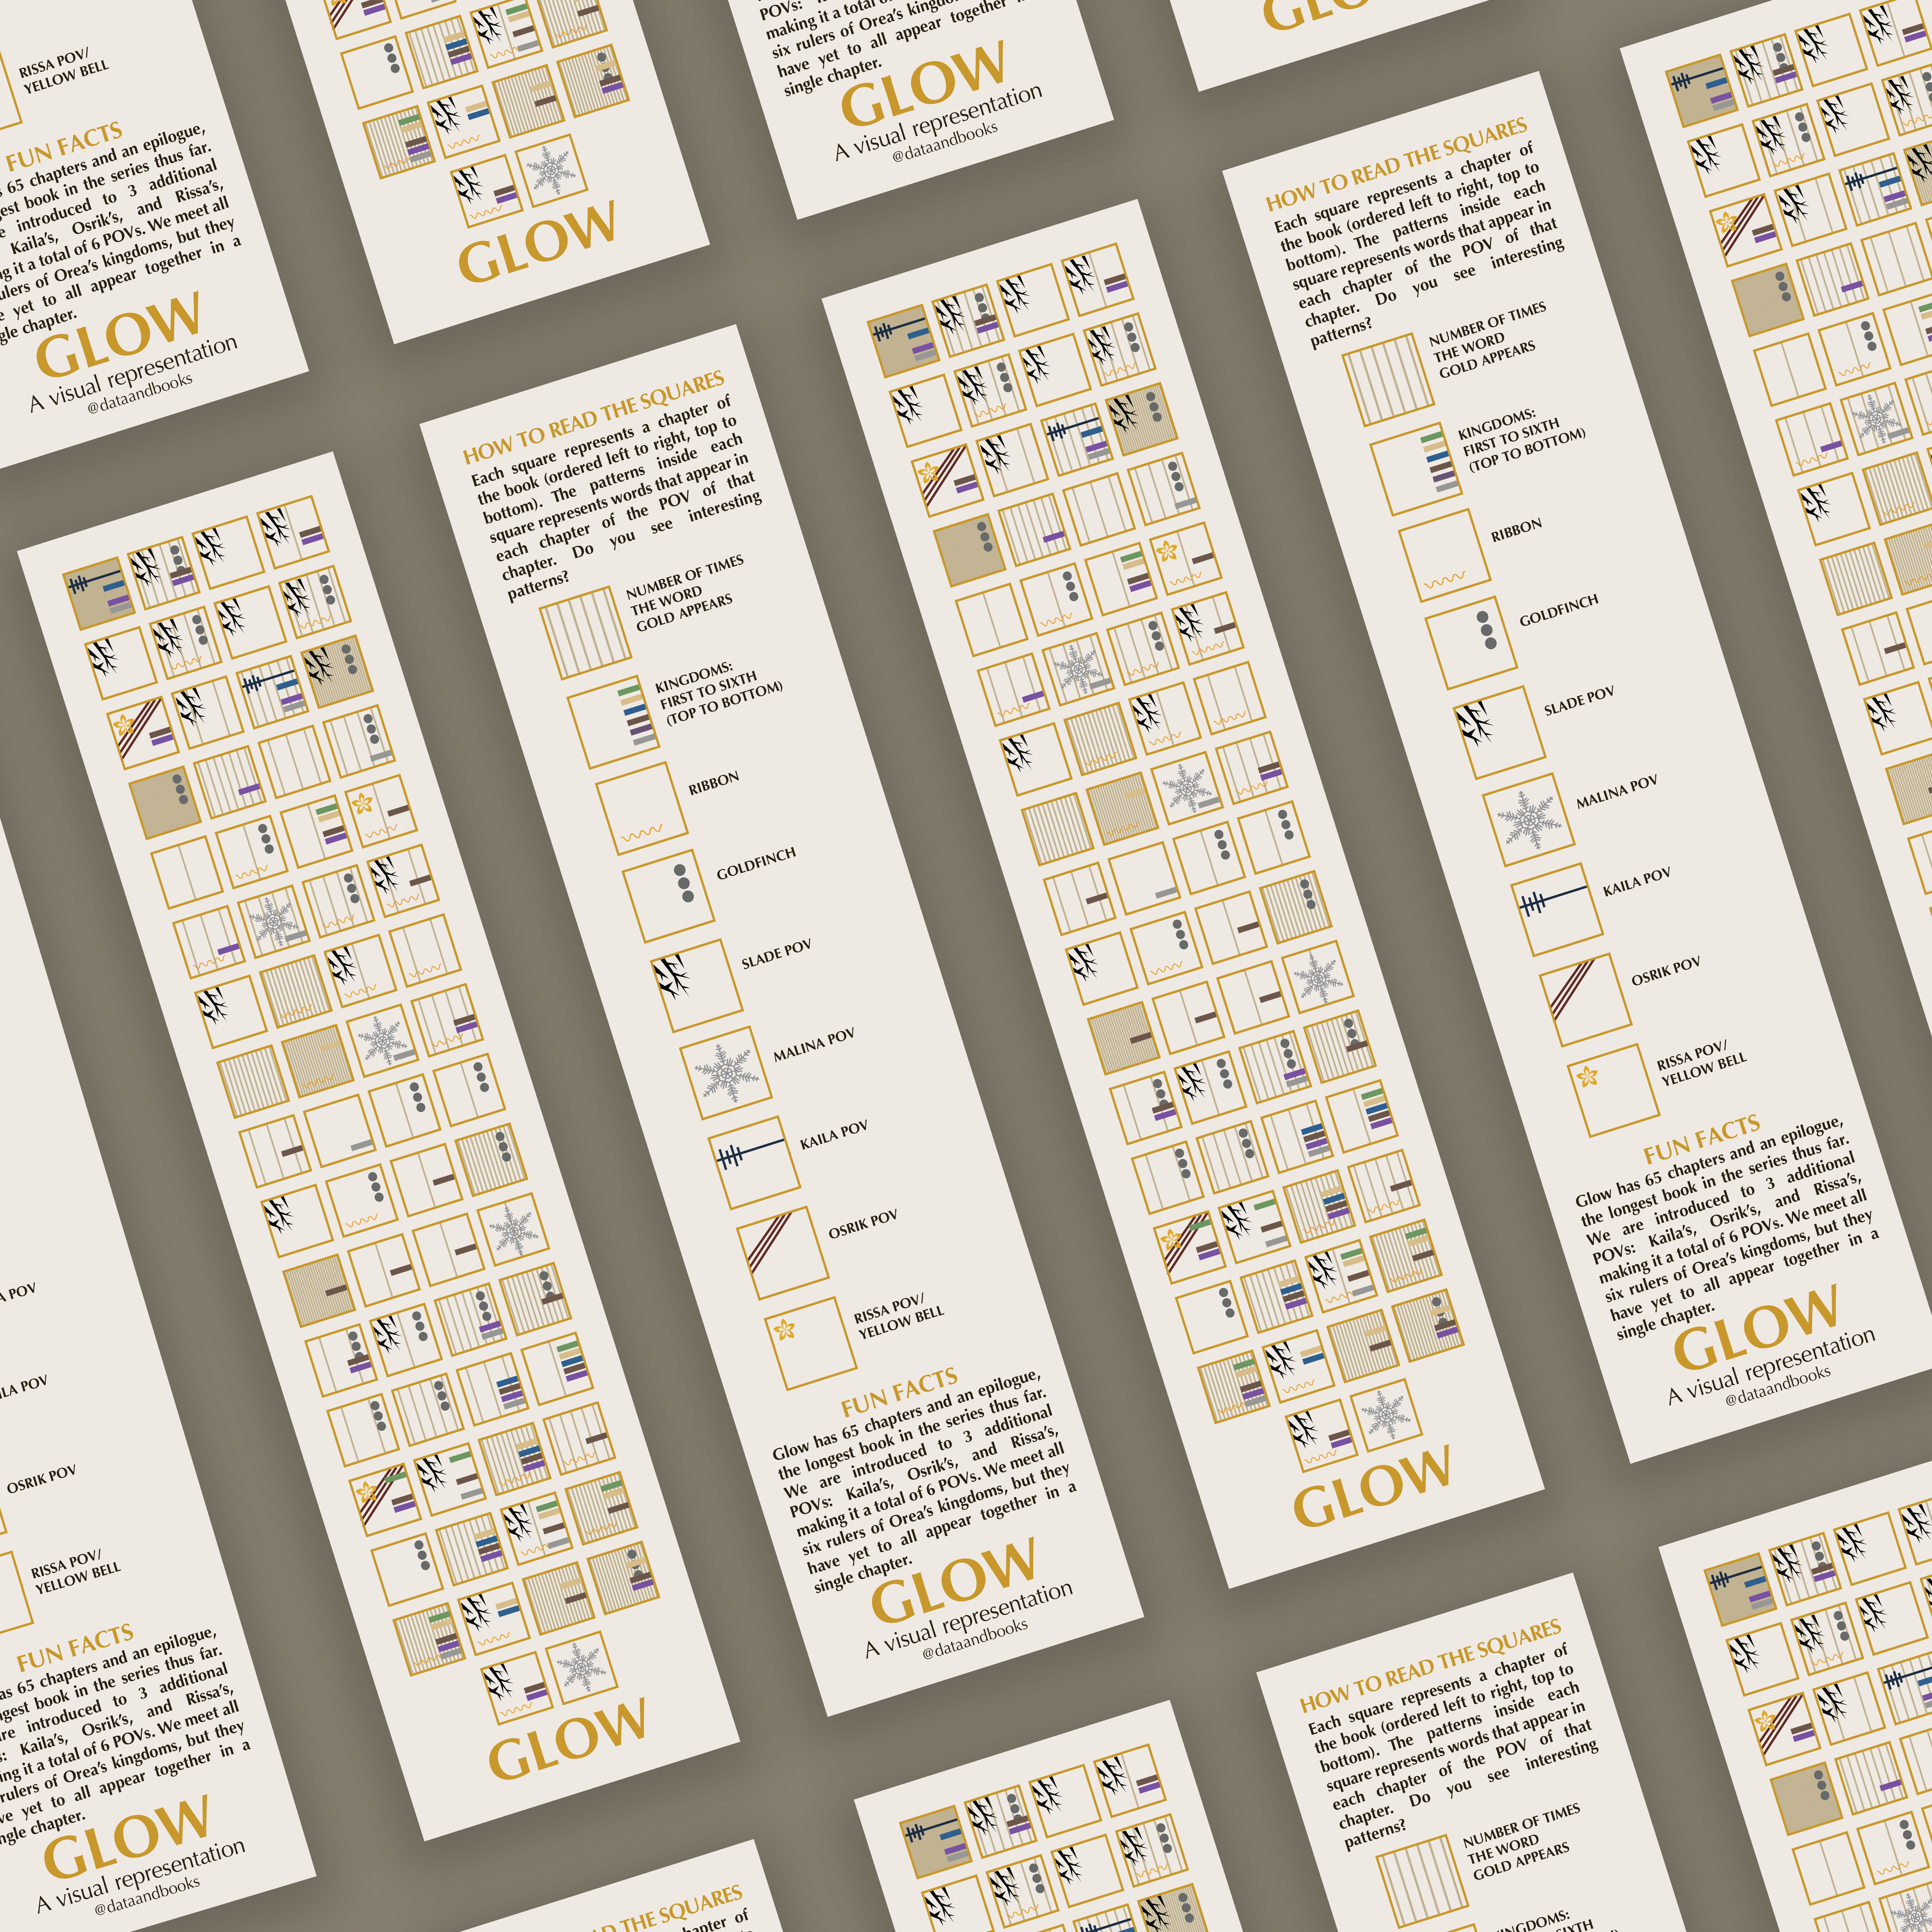
My primary medium is poster infographics and carousel posts for Instagram, showcasing intricate and engaging data narratives.
Some of my work specifically made for Instagram Carousels:

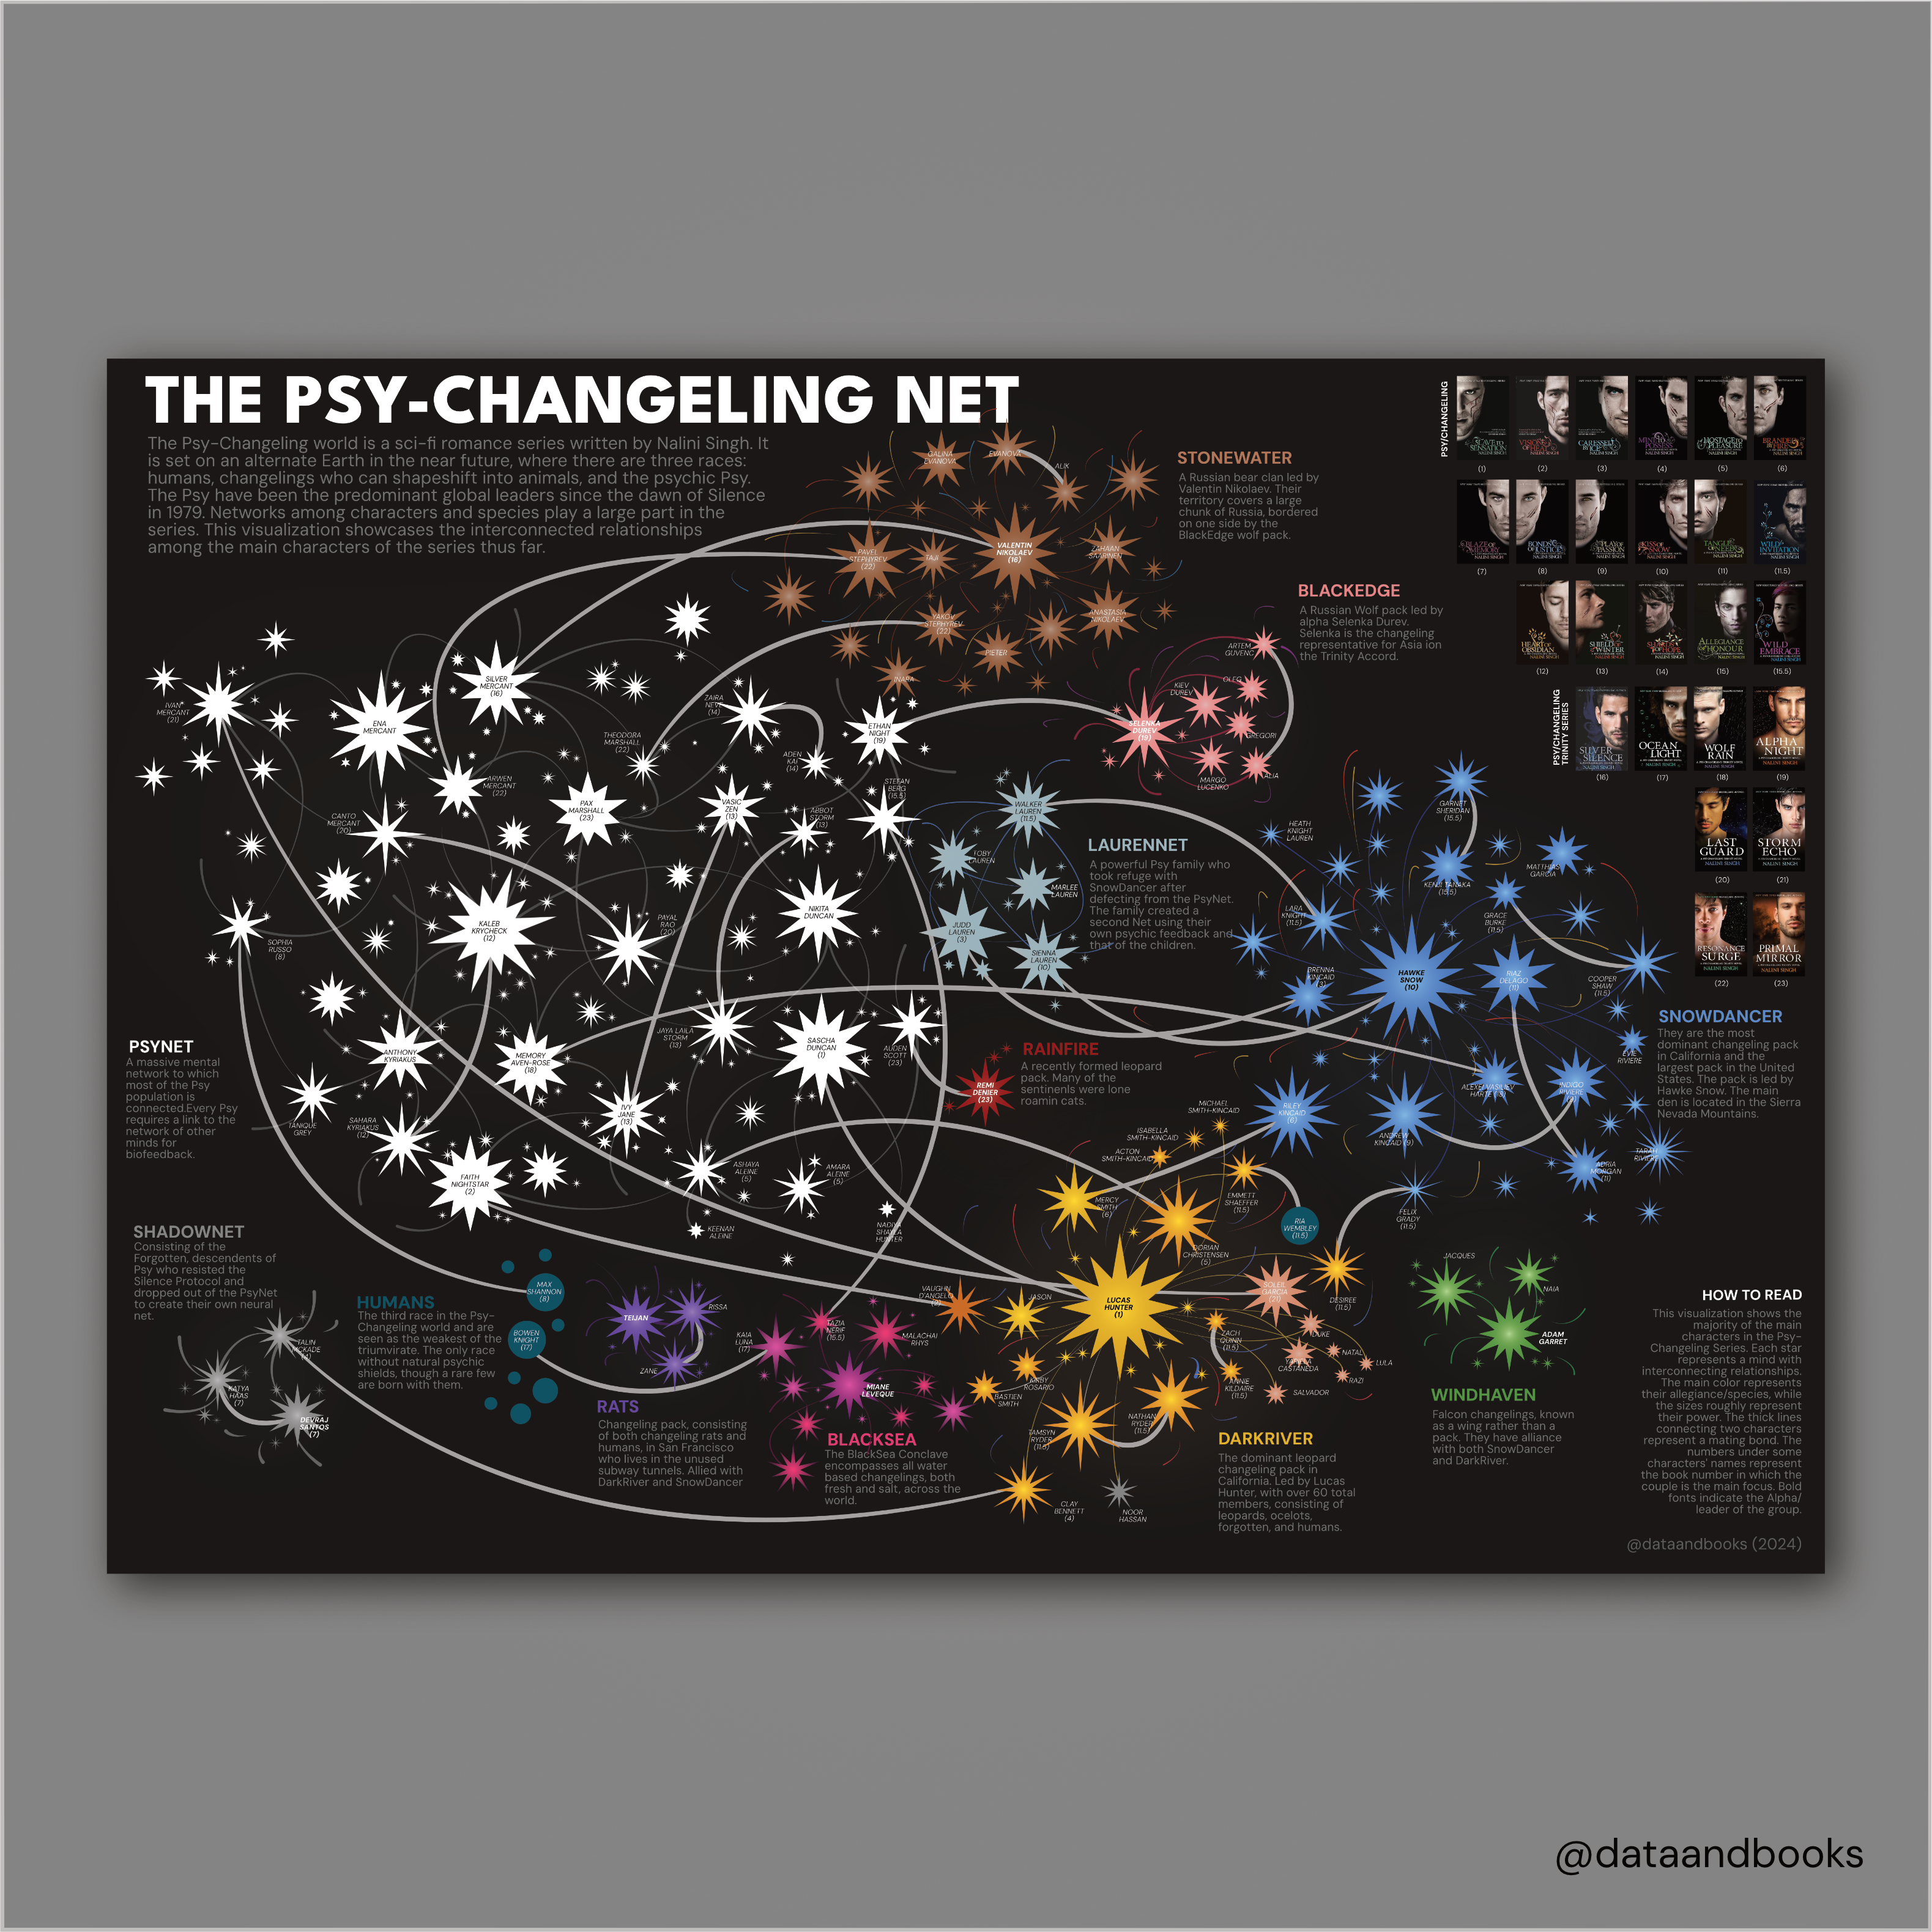
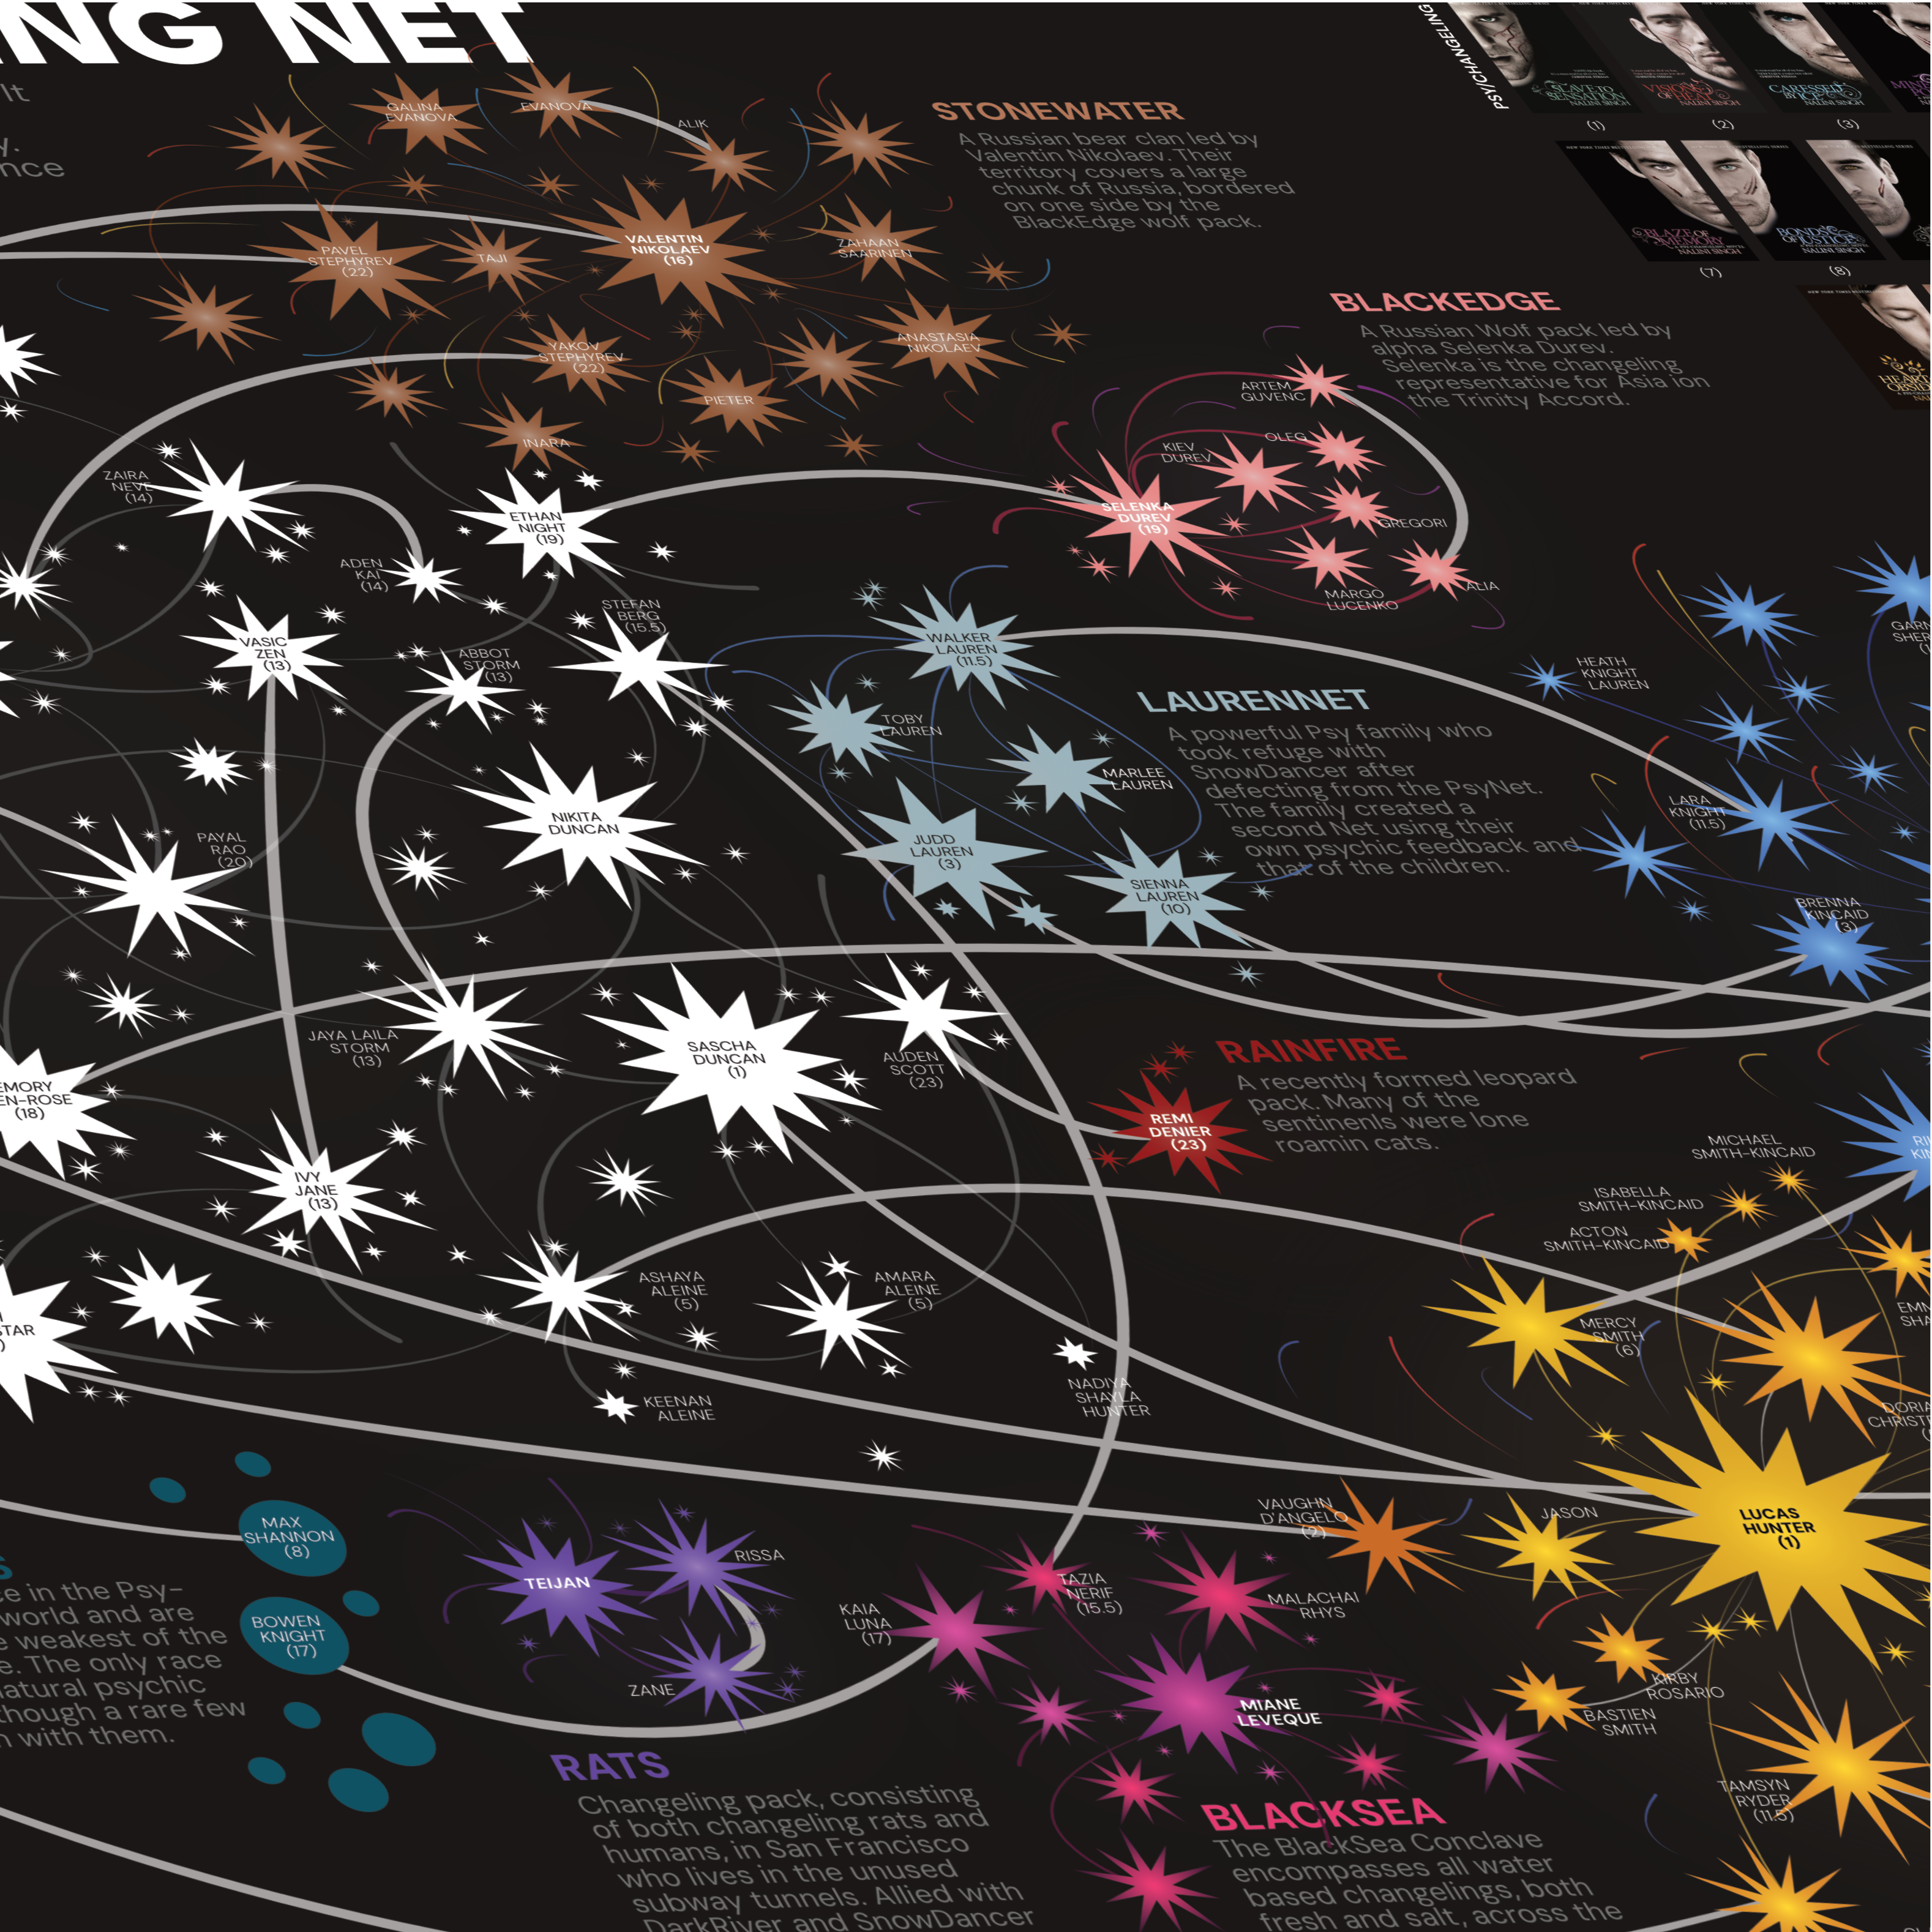
And some that are a combination of code and manual design:
And finally, some more freeform infographics:
If you’re interested in buying some of my work, visit my Etsy store